Analytics & Reports
Track performance across your workspace with modular, customizable dashboards. Monitor contacts, events, campaigns, and revenue in one place.
Dashboard Widgets
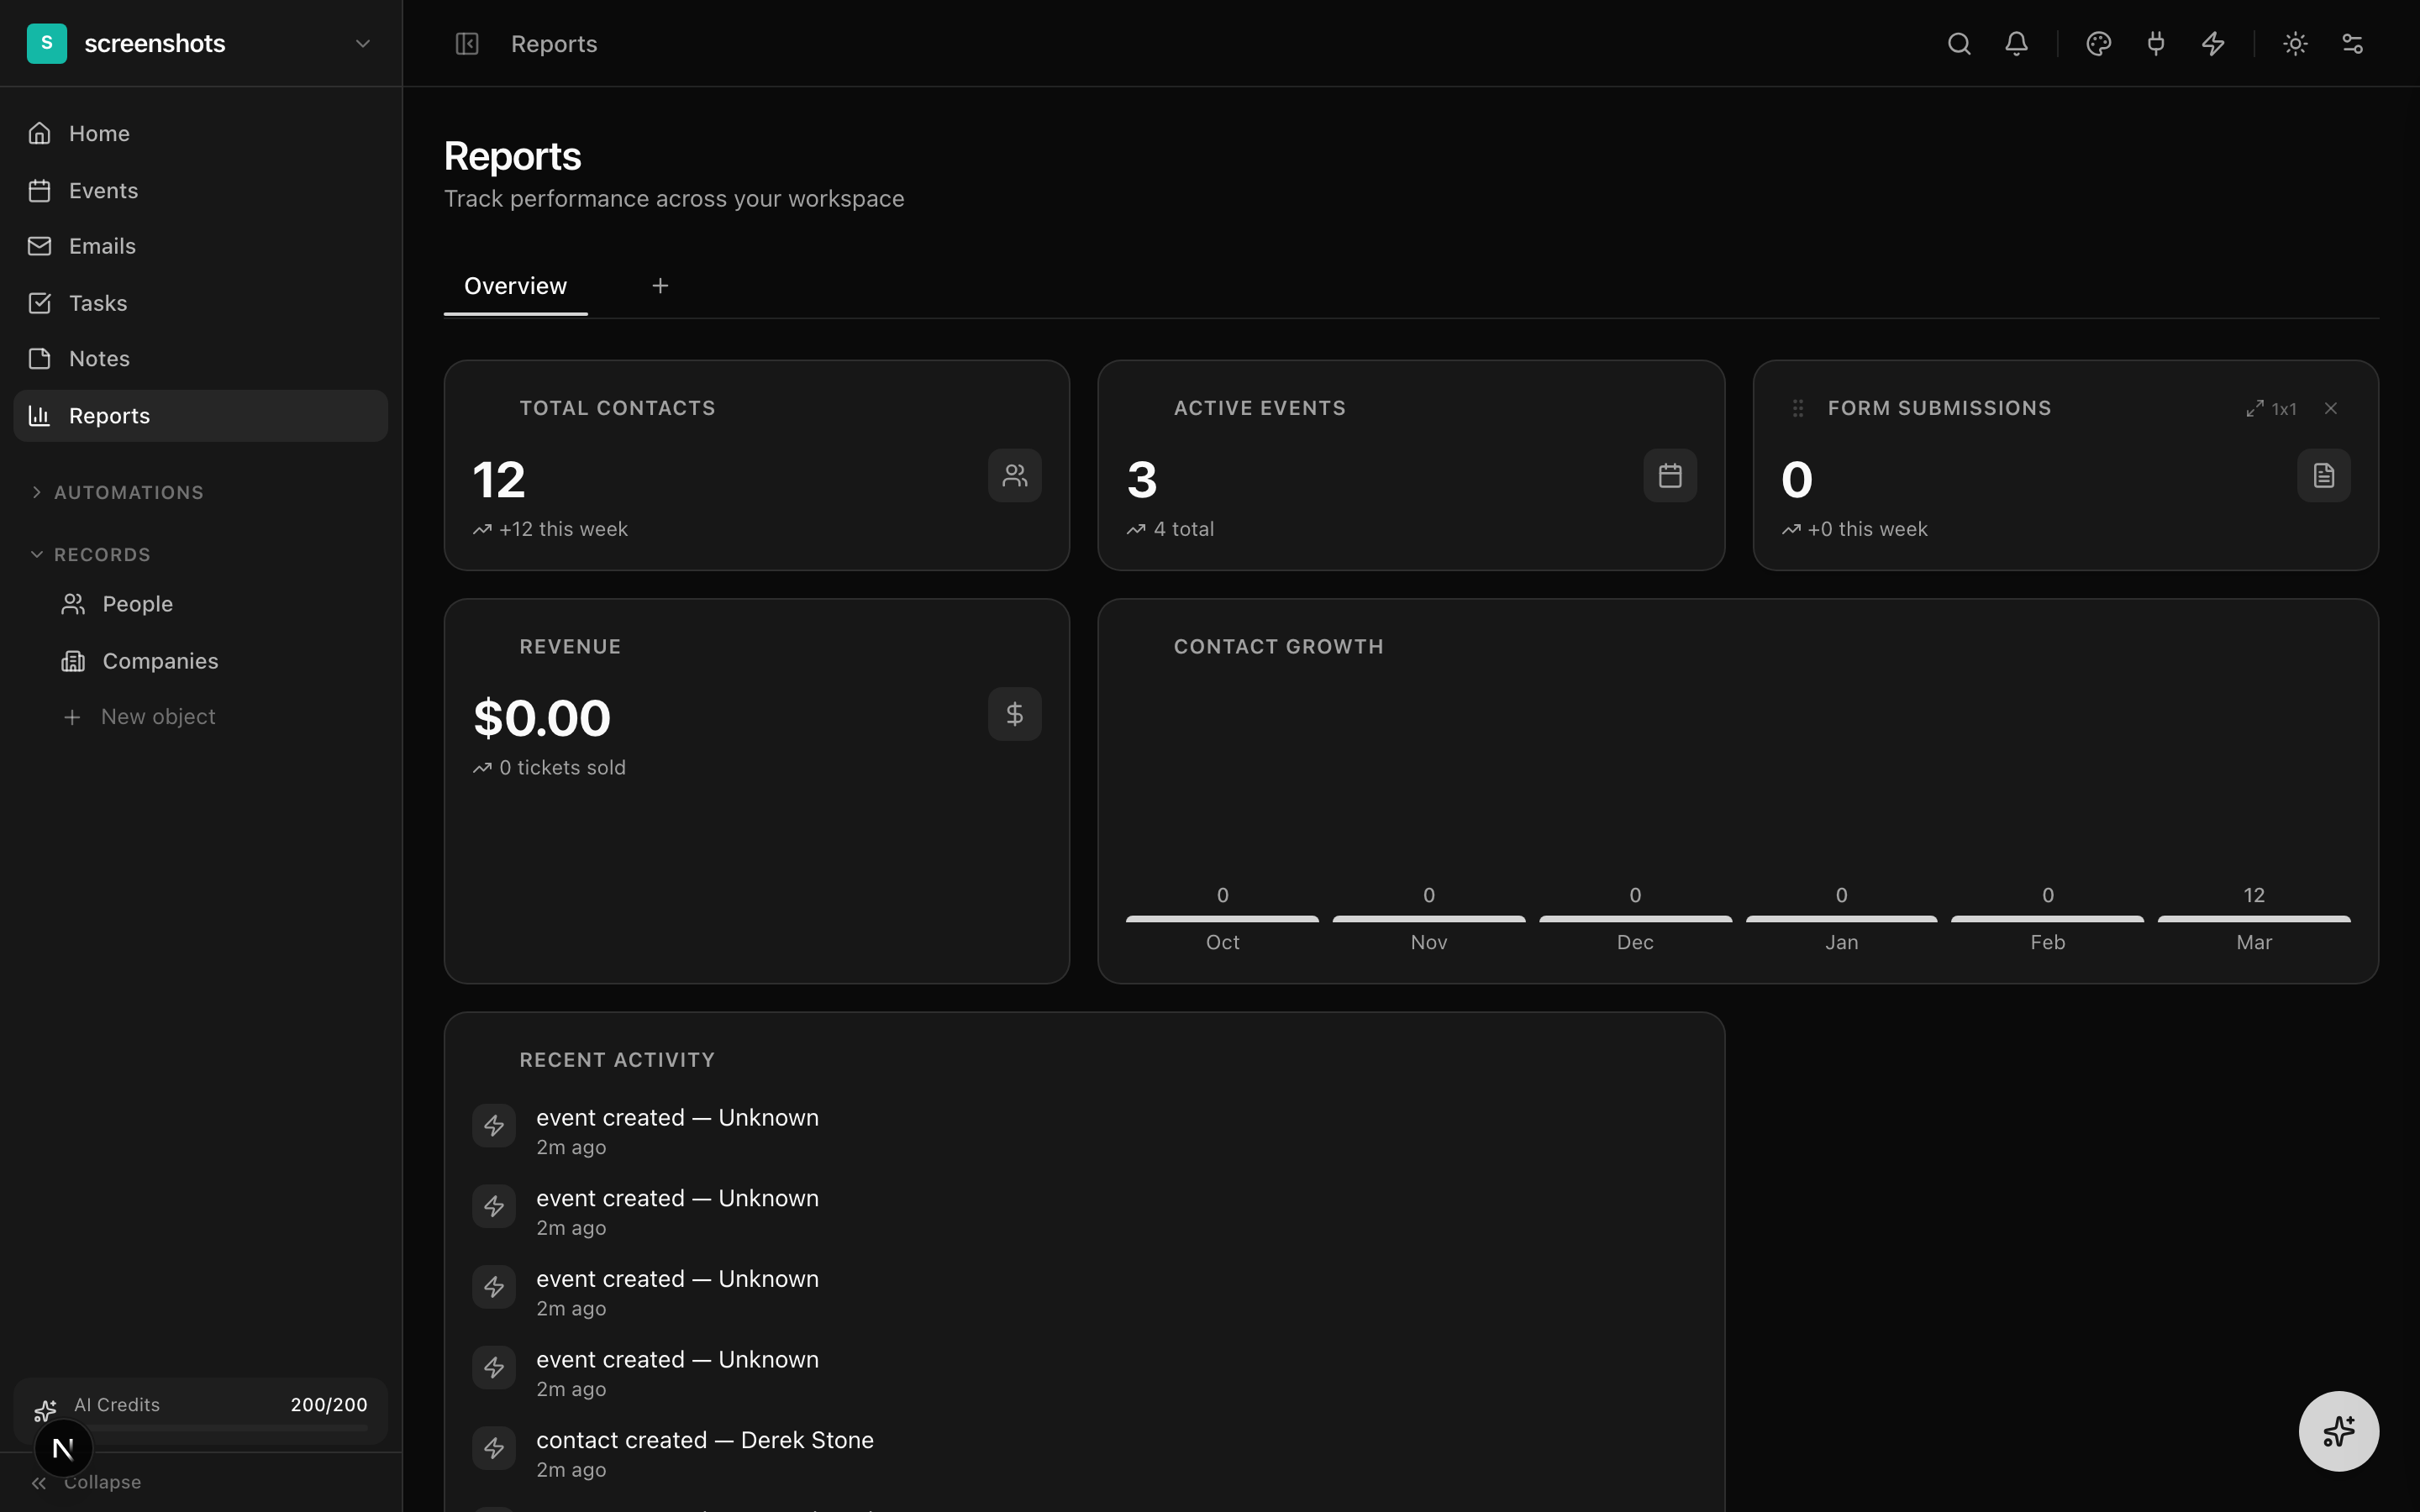
The reports dashboard is composed of modular widgets that you can arrange and resize to build your ideal overview.
Available Widget Types
- Stat cards — single-metric displays showing a number with a label and optional trend indicator (e.g., "Total Contacts: 2,450 +12% this month")
- Bar charts — compare values across categories (e.g., tickets sold by event, contacts by source)
- Line charts — track metrics over time (e.g., contact growth, revenue trend, email engagement)
- Recent activity — a live feed of the latest actions in your workspace: signups, purchases, form submissions
- Top events — ranked list of your best-performing events by revenue or ticket sales
- Contact growth — chart showing new contacts added over time with source breakdown
How to Customize the Dashboard
- Click "Customize" in the top-right corner of the reports page to enter edit mode.
- Click "Add Widget" to add a new widget. Choose the widget type and configure its data source.
- Drag widgets to rearrange their position on the dashboard.
- Click the resize button on any widget to cycle through small, medium, and large sizes.
- Click the settings icon on a widget to reconfigure its data source, title, or time range.
- Click "Done" to exit edit mode and save your layout.
Saved Views
Save custom dashboard layouts as named views so you can switch between different perspectives quickly.
How to Create a Saved View
- Customize your dashboard layout with the widgets and arrangement you want.
- Click "Save View" in the toolbar.
- Enter a name for the view (e.g., "Revenue Overview," "Event Performance," "Marketing Metrics").
- The view is saved and appears in the view switcher dropdown.
- Share a view with team members by copying its URL — each view has a unique permalink.
Each team member can have their own default view. The view they last selected is remembered and loaded automatically when they return to the analytics page.
Key Metrics Explained
Understanding the metrics available across your workspace:
Contact Metrics
- Total contacts — all people in your workspace regardless of status
- Active subscribers — people with "Active" subscription status eligible for campaigns
- New this period — contacts created within the selected time range
- Growth rate — percentage change in total contacts vs. the previous period
Event Metrics
- Tickets sold — total tickets purchased across all events
- Revenue — total ticket revenue (before Stripe fees)
- Sell-through rate — percentage of available tickets that have been sold
- Check-in rate — percentage of ticket holders who checked in at the event
Campaign Metrics
- Emails sent — total emails sent this period across all campaigns
- Open rate — percentage of delivered emails that were opened (unique)
- Click-through rate (CTR) — percentage of delivered emails that received a click
- Unsubscribe rate — percentage of recipients who unsubscribed from a campaign